Monitoring Backups With Extended Events
This sure has taken me a while to produce. I’ve been working on it for about a month now. However, I went to the 2013 PASS Summit and have been trying to work through implementing many of the things that I learned there in our environment. Just about the time I got a handle on that, I went on call and the rest has been a blur. Also, sorry the screencaps are so small. I’ll do better next time. I’m really starting to enjoy Extended Events! In our environment, we have a few large databases for which we’ve been trying to figure out how to improve the speed of our backups.
The Event Session (straight from Jonathan Kehayias): [code language=“sql”] – Create the Event Session CREATE EVENT SESSION BackupMonitoring ON SERVER ADD EVENT sqlserver.sql_statement_starting ( ACTION (sqlserver.database_id, sqlserver.sql_text) WHERE (sqlserver.session_id = 59)), ADD EVENT sqlserver.sql_statement_completed ( ACTION (sqlserver.database_id, sqlserver.sql_text) WHERE (sqlserver.session_id = 59)), ADD EVENT sqlserver.databases_backup_restore_throughput ( WHERE (sqlserver.session_id = 59)), ADD EVENT sqlos.wait_info ( ACTION (sqlserver.database_id) WHERE (sqlserver.session_id = 59 AND duration > 0)), ADD EVENT sqlos.wait_info_external ( ACTION (sqlserver.database_id) WHERE (sqlserver.session_id = 59 AND duration > 0)), ADD EVENT sqlserver.trace_print ( WHERE (sqlserver.session_id = 59)), ADD EVENT sqlserver.file_read ( WHERE (sqlserver.session_id = 59)), ADD EVENT sqlserver.file_read_completed ( WHERE (sqlserver.session_id = 59)), ADD EVENT sqlserver.physical_page_read ( WHERE (sqlserver.session_id = 59)), ADD EVENT sqlserver.databases_log_cache_read ( WHERE (database_id = 11)), ADD EVENT sqlserver.databases_log_cache_hit ( WHERE (database_id = 11)), ADD EVENT sqlserver.databases_log_flush ( WHERE (database_id = 11)), ADD EVENT sqlserver.checkpoint_begin ( WHERE (database_id = 11)), ADD EVENT sqlserver.checkpoint_end ( WHERE (database_id = 11)) ADD TARGET package0.event_file( SET filename=’D:\temp\BackupMonitoring1.xel’, metadatafile = ’D:\temp\BackupMonitoring1.xem’) WITH (TRACK_CAUSALITY = ON); GO [/code] Then run it [code language=“sql”] ALTER EVENT SESSION BackupMonitoring ON SERVER STATE=START GO
BACKUP DATABASE [db_name] TO DISK=N’NUL’ –BACKUP DATABASE successfully processed 473620 pages in 42.130 seconds (87.827 MB/sec). ,DISK=N’NUL’ –BACKUP DATABASE successfully processed 473619 pages in 22.876 seconds (161.747 MB/sec). ,DISK=N’NUL’ –BACKUP DATABASE successfully processed 473634 pages in 18.844 seconds (196.362 MB/sec). ,DISK=N’NUL’ –BACKUP DATABASE successfully processed 473674 pages in 12.888 seconds (287.133 MB/sec). ,DISK=N’NUL’ –BACKUP DATABASE successfully processed 473682 pages in 15.569 seconds (237.692 MB/sec). ,DISK=N’NUL’ –BACKUP DATABASE successfully processed 472747 pages in 12.214 seconds (302.385 MB/sec). ,DISK=N’NUL’ –BACKUP DATABASE successfully processed 473371 pages in 30.870 seconds (119.799 MB/sec). ,DISK=N’NUL’ –BACKUP DATABASE successfully processed 473564 pages in 16.405 seconds (225.523 MB/sec). ,DISK=N’NUL’ –BACKUP DATABASE successfully processed 473566 pages in 12.004 seconds (308.208 MB/sec). ,DISK=N’NUL’ –BACKUP DATABASE successfully processed 473562 pages in 11.328 seconds (326.597 MB/sec). WITH STATS=10
ALTER EVENT SESSION BackupMonitoring ON SERVER STATE=STOP [/code] Start the session, backup the database, stop the session. As you can see, I ran this 10 times (our internal policy is to allow a maximum of 10 stripes per database). Just to be sure I didn’t get any overlap (and to spare me the work of only reading timestamped event files), I would read the event file into a table (in tempdb) and then delete the event files before I reran the process. (also shamelessly lifted from the same Jonathan Kehayias blog post) [code language=“sql”] SELECT event_data.value(‘(event/@name)[1]‘, ‘varchar(50)’) AS event_name, event_data.value(‘(event/@package)[1]‘, ‘varchar(50)’) AS package_name, DATEADD(hh, DATEDIFF(hh, GETUTCDATE(), CURRENT_TIMESTAMP), event_data.value(‘(event/@timestamp)[1]‘, ‘datetime2’)) AS [timestamp], COALESCE(event_data.value(‘(event/data[@name=“database_id”]/value)[1]‘, ‘int’), event_data.value(‘(event/action[@name=“database_id”]/value)[1]‘, ‘int’)) AS database_id, event_data.value(‘(event/data[@name=“message”]/value)[1]‘, ‘nvarchar(4000)’) AS trace_print, event_data.value(‘(event/data[@name=“count”]/value)[1]‘, ‘bigint’) AS [count], event_data.value(‘(event/data[@name=“increment”]/value)[1]‘, ‘bigint’) AS [increment], event_data.value(‘(event/data[@name=“wait_type”]/text)[1]‘, ‘nvarchar(100)’) AS wait_type, event_data.value(‘(event/data[@name=“opcode”]/text)[1]‘, ‘nvarchar(10)’) AS opcode, event_data.value(‘(event/data[@name=“duration”]/value)[1]‘, ‘bigint’) AS duration, event_data.value(‘(event/data[@name=“max_duration”]/value)[1]‘, ‘bigint’) AS max_duration, event_data.value(‘(event/data[@name=“total_duration”]/value)[1]‘, ‘bigint’) AS total_duration, event_data.value(‘(event/data[@name=“signal_duration”]/value)[1]‘, ‘bigint’) AS signal_duration, event_data.value(‘(event/data[@name=“completed_count”]/value)[1]‘, ‘bigint’) AS completed_count, event_data.value(‘(event/data[@name=“source_database_id”]/value)[1]‘, ‘int’) AS source_database_id, event_data.value(‘(event/data[@name=“object_id”]/value)[1]‘, ‘int’) AS OBJECT_ID, event_data.value(‘(event/data[@name=“object_type”]/value)[1]‘, ‘int’) AS object_type, event_data.value(‘(event/data[@name=“state”]/text)[1]‘, ‘nvarchar(50)’) AS state, event_data.value(‘(event/data[@name=“offset”]/value)[1]‘, ‘bigint’) AS offset, event_data.value(‘(event/data[@name=“offset_end”]/value)[1]‘, ‘int’) AS offset_end, event_data.value(‘(event/data[@name=“nest_level”]/value)[1]‘, ‘int’) AS nest_level, event_data.value(‘(event/data[@name=“cpu”]/value)[1]‘, ‘int’) AS cpu, event_data.value(‘(event/data[@name=“reads”]/value)[1]‘, ‘bigint’) AS reads, event_data.value(‘(event/data[@name=“writes”]/value)[1]‘, ‘bigint’) AS writes, event_data.value(‘(event/data[@name=“mode”]/text)[1]‘, ‘nvarchar(50)’) AS mmode, event_data.value(‘(event/data[@name=“file_id”]/value)[1]‘, ‘int’) AS FILE_ID, event_data.value(‘(event/data[@name=“page_id”]/value)[1]‘, ‘int’) AS page_id, event_data.value(‘(event/data[@name=“file_group_id”]/value)[1]‘, ‘int’) AS file_group_id, event_data.value(‘(event/action[@name=“sql_text”]/value)[1]‘, ‘nvarchar(4000)’) AS sql_text, CAST(SUBSTRING(event_data.value(‘(event/action[@name=“attach_activity_id”]/value)[1]‘, ‘varchar(50)’), 1, 36) AS uniqueidentifier) as activity_id, CAST(SUBSTRING(event_data.value(‘(event/action[@name=“attach_activity_id”]/value)[1]‘, ‘varchar(50)’), 38, 10) AS int) as event_sequence, CAST(SUBSTRING(event_data.value(‘(event/action[@name=“attach_activity_id_xfer”]/value)[1]‘, ‘varchar(50)’), 1, 36) AS uniqueidentifier) as activity_id_xfer INTO tempdb.dbo.TenStripe – here’s where you can tell how creative I was with my temp table naming convention FROM ( SELECT CAST(event_data AS XML) AS event_data FROM sys.fn_xe_file_target_read_file(’D:\temp\BackupMonitoring1*.xel’, NULL, NULL, NULL) ) ed [/code] Of course, I’m sending this backup to a NUL device which is essentially a virtual file that where the information contained within it is discarded so I’m really only testing maximum theoretical backup speed since there’s negligible write overhead associated with this. That’s OK for the sake of this experiment because what I really wanted to test was if I could see if I could get a sense of how the events fired when a backup is striped across multiple files.
Once I had my collection of temp tables, I aggregated them into another table [code language=“sql”] SELECT * INTO [Analysis].[dbo].[BackupAnalysis] FROM (
SELECT
1 AS NumberOfStripes,
ROW_NUMBER() OVER (ORDER BY [timestamp], event_sequence) AS RowID,
*
FROM tempdb.dbo.SingleStripe
UNION ALL
SELECT
2 AS NumberOfStripes,
ROW_NUMBER() OVER (ORDER BY [timestamp], event_sequence) AS RowID,
*
FROM tempdb.dbo.DoubleStripe
UNION ALL
SELECT
3 AS NumberOfStripes,
ROW_NUMBER() OVER (ORDER BY [timestamp], event_sequence) AS RowID,
*
FROM tempdb.dbo.TripleStripe
UNION ALL
SELECT
4 AS NumberOfStripes,
ROW_NUMBER() OVER (ORDER BY [timestamp], event_sequence) AS RowID,
*
FROM tempdb.dbo.QuadStripe
UNION ALL
… –at five stripes I transitioned to {Number}Stripe
SELECT
10 AS NumberOfStripes,
ROW_NUMBER() OVER (ORDER BY [timestamp], event_sequence) AS RowID,
*
FROM tempdb.dbo.TenStripe
) ba
[/code]
Now it’s time to start sanity-checking the data to see if what I’ve got is even usable.
[code language=“sql”]
SELECT NumberOfStripes, SUM(increment)
FROM dbo.BackupAnalysis
GROUP BY NumberOfStripes
ORDER BY NumberOfStripes
[/code]
 The throughput numbers are similar so we can reasonably assume that the amount of data being passed through to its “final destination.”
My “control” will be a backup with a single stripe, so I query my analysis table
[code language=“sql”]
SELECT event_name, timestamp, trace_print, increment, activity_id, activity_id_xfer, event_sequence
FROM dbo.BackupAnalysis
WHERE NumberOfStripes = 1
AND (trace_print IS NOT NULL OR increment IS NOT NULL)
ORDER BY timestamp
[/code]
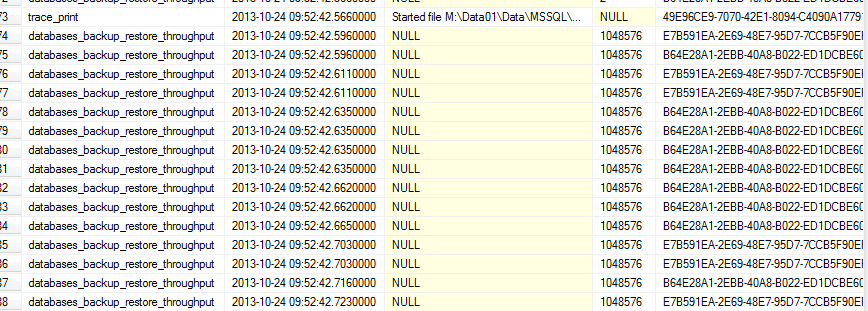
 I’m filtering out the data that I don’t want (for now) and just getting the trace outputs (so that I know where to begin looking) and the increments from the throughput event. The key piece of information for which I am searching is how many activity_ids are spawned during this actual period of time. We see a 4026 throughput events which are mostly incrementing at 1048576 bytes (1MB). There are some that are smaller but for the scope of this task, the significant information is that the entirety of the backup process is done by the same activity_id 2E3D71EB-BBDF-4725-9DFA-318CBC16CECE (interestingly, the file headers are written by a different activity, 2E3D71EB-BBDF-4725-9DFA-318CBC16CECE).
Why is this significant? The point of this exercise was to determine if I could separate the throughput of each stripe to see if I can isolate a potential backup bottleneck on my striped backups. Let’s look at the backup with two stripes:
[code language=“sql”]
SELECT event_name, timestamp, trace_print, increment, activity_id, activity_id_xfer, event_sequence
FROM dbo.BackupAnalysis
WHERE NumberOfStripes = 2
AND (trace_print IS NOT NULL OR increment IS NOT NULL)
ORDER BY timestamp
[/code]
 In the same section I now have two distinct activity_ids. Just for fun let’s check the 10-stripe backup.
[code language=“sql”]
SELECT COUNT(DISTINCT activity_id )
FROM (
SELECT ROW_NUMBER() OVER (ORDER BY timestamp) AS rn, event_name, timestamp, trace_print, increment, activity_id, activity_id_xfer, event_sequence
FROM dbo.BackupAnalysis
WHERE NumberOfStripes = 10
AND (trace_print IS NOT NULL OR increment IS NOT NULL)
–ORDER BY timestamp
) j
WHERE rn BETWEEN
314 AND 4361
[/code]
 I ran the inner query to get my boundaries which I want to be the beginning and end of the large throughput that reflect the main backup activity. You see the first occurrence at row number 314 and the last occurrence at 4361.
 Row 4351 is an important trace_print event because it is a new activity_id. Running this query gives me a count of 11. So row 4351 is important because it added that additional activity_id. So with a backup that is striped across 10 files, we have 10 distinct, simultaneous activities writing to each stripe.
So there we have it, each stripe gets its own activity_id. This information will be helpful as I attempt to see which stripe is getting bogged down in our backup process.