More Information on DBCC CHECKs With New Extended Events in SQL Server 2014 CTP1
There have been a few blog posts about the new DMVs that are being introduced in SQL Server 2014 CTP1, but Bob Beauchamin has what seems to be the most definitive list of new Extended Events in the CTP. There’s no real information out there, though, on how to use them. That’s probably because it may be a bit too early, but I like taking things apart so I figured I’d check it out. Robert Davis has a good writeup for using the databases_dbcc_logical_scan to determine if DBCC CHECK automatically used a snapshot for its scan. To complement hat event, there were four new DBCC CHECK events added in CTP1:
check_phase_tracing - Occurs when DBCC CHECK enters a new phase of the checking. Use this event to trace the phases of DBCC CHECK process.
check_thread_message_statistics - Occurs when a phase of DBCC CHECK is finished. Use this event to collect the number of messages a DBCC CHECK thread has sent or received.
check_thread_page_io_statistics - Occurs when a phase of DBCC CHECK is finished. Use this event to collect the number of logical, physical, and read-ahead IOs a DBCC CHECK thread has performed.
check_thread_page_latch_statistics - Occurs when a phase of DBCC CHECK is finished. Use This event to collect the number and time of page latch and IO latch waits.
I wanted to see what the difference between a fairly vanilla event session with the new events compared to the older events. For this exercise, I have a database of Ancient Greek texts with wide data, mixed collations, and quite a few NVARCHAR(MAX) data points that I’m going to use.
Here’s the code for the new event session:
[code language=“sql”] CREATE EVENT SESSION [TestCheck] ON SERVER ADD EVENT sqlserver.check_phase_tracing( ACTION(sqlserver.database_id, sqlserver.database_name)), ADD EVENT sqlserver.check_thread_message_statistics( ACTION(sqlserver.database_id, sqlserver.database_name)), ADD EVENT sqlserver.check_thread_page_io_statistics( ACTION(sqlserver.database_id, sqlserver.database_name)), ADD EVENT sqlserver.check_thread_page_latch_statistics( ACTION(sqlserver.database_id, sqlserver.database_name)) ADD TARGET package0.ring_buffer WITH (MAX_DISPATCH_LATENCY=30 SECONDS, MAX_EVENT_SIZE=0 KB, TRACK_CAUSALITY=ON); GO –Create the event session for the event that already exists
CREATE EVENT SESSION OldCheck ON SERVER ADD EVENT sqlserver.databases_dbcc_logical_scan( ACTION(sqlserver.database_id, sqlserver.database_name)) ADD TARGET package0.ring_buffer WITH (MAX_DISPATCH_LATENCY=30 SECONDS, MAX_EVENT_SIZE=0 KB, TRACK_CAUSALITY=ON); GO –start the sessions
ALTER EVENT SESSION [TestCheck] ON SERVER STATE = START; GO ALTER EVENT SESSION [OldCheck] ON SERVER STATE = START; GO –run the check WITH DATA_PURITY
DBCC CHECKDB WITH DATA_PURITY; GO [/code]
When the DBCC CHECKDB completes we can check the event ring buffer for recorded events (I stored them in tables for future analysis):
[code language=“sql”] –Modified from Jonathan Kehayias http://www.sqlskills.com/blogs/jonathan/an-xevent-a-day-6-of-31-targets-week-asynchronous_file_target/ –TestCheck (new event session target data) SELECT * INTO NewSession FROM ( SELECT event_data.value(‘(event/@name)[1]‘, ‘varchar(50)’) AS event_name, DATEADD(hh,DATEDIFF(hh, GETUTCDATE(), CURRENT_TIMESTAMP), event_data.value(‘(event/@timestamp)[1]‘, ‘datetime2’)) AS [timestamp], event_data.value(‘(event/data[@name=“database_id”]/value)[1]‘, ‘sysname’) AS event_database_id, event_data.value(‘(event/action[@name=“database_id”]/value)[1]‘, ‘sysname’) AS action_database_id, event_data.value(‘(event/data[@name=“opcode”]/text)[1]‘, ‘NVARCHAR(25)’) AS opcode_text, event_data.value(‘(event/data[@name=“call_duration”]/value)[1]‘, ‘bigint’) AS call_duration, event_data.value(‘(event/data[@name=“is_remote”]/value)[1]‘, ‘bit’) AS is_remote, event_data.value(‘(event/data[@name=“command_phase”]/text)[1]‘, ‘nvarchar(100)’) AS command_phase_text, event_data.value(‘(event/data[@name=“logical_reads”]/value)[1]‘, ‘bigint’) AS logical_reads, event_data.value(‘(event/data[@name=“physical_reads”]/value)[1]‘, ‘bigint’) AS physical_reads, event_data.value(‘(event/data[@name=“run_ahead_reads”]/value)[1]‘, ‘bigint’) AS run_ahead_reads, event_data.value(‘(event/data[@name=“total_page_io_latch_waits”]/value)[1]‘, ‘bigint’) AS total_page_io_latch_waits, event_data.value(‘(event/data[@name=“page_io_latch_wait_time_in_ms”]/value)[1]‘, ‘bigint’) AS page_io_latch_wait_time_in_ms, event_data.value(‘(event/data[@name=“total_page_latch_waits”]/value)[1]‘, ‘bigint’) AS total_page_latch_waits, event_data.value(‘(event/data[@name=“page_latch_wait_time_in_ms”]/value)[1]‘, ‘bigint’) AS page_latch_wait_time_in_ms, event_data.value(‘(event/data[@name=“messages_sent”]/value)[1]‘, ‘int’) AS messages_sent, event_data.value(‘(event/data[@name=“messages_received”]/value)[1]‘, ‘int’) AS messages_received, event_data.value(‘(event/action[@name=“database_name”]/value)[1]‘, ‘sysname’) AS database_name, CAST(SUBSTRING(event_data.value(‘(event/action[@name=“attach_activity_id”]/value)[1]‘, ‘varchar(50)’), 1, 36) AS uniqueidentifier) as activity_id, CAST(SUBSTRING(event_data.value(‘(event/action[@name=“attach_activity_id”]/value)[1]‘, ‘varchar(50)’), 38, 10) AS int) as event_sequence, CAST(SUBSTRING(event_data.value(‘(event/action[@name=“attach_activity_id_xfer”]/value)[1]‘, ‘varchar(50)’), 1, 36) AS uniqueidentifier) as activity_id_xfer FROM ( SELECT XEvent.query(‘.’) AS event_data FROM ( – Cast the target_data to XML SELECT CAST(target_data AS XML) AS TargetData FROM sys.dm_xe_session_targets st JOIN sys.dm_xe_sessions s ON s.address = st.event_session_address WHERE name = ‘TestCheck’ AND target_name = ‘ring_buffer’ ) AS Data – Split out the Event Nodes CROSS APPLY TargetData.nodes (‘RingBufferTarget/event’) AS XEventData (XEvent) ) AS tab (event_data) ) xedata ORDER BY timestamp – ORDER BY activity_id, event_sequence
–OldCheck (Old Session) SELECT * INTO OldSession FROM ( SELECT event_data.value(‘(event/@name)[1]‘, ‘varchar(50)’) AS event_name, DATEADD(hh,DATEDIFF(hh, GETUTCDATE(), CURRENT_TIMESTAMP), event_data.value(‘(event/@timestamp)[1]‘, ‘datetime2’)) AS [timestamp], event_data.value(‘(event/data[@name=“count”]/value)[1]‘, ‘bigint’) AS count, event_data.value(‘(event/data[@name=“database_id”]/value)[1]‘, ‘sysname’) AS event_database_id, event_data.value(‘(event/action[@name=“database_id”]/value)[1]‘, ‘sysname’) AS action_database_id, event_data.value(‘(event/action[@name=“database_name”]/value)[1]‘, ‘sysname’) AS action_database_name, CAST(SUBSTRING(event_data.value(‘(event/action[@name=“attach_activity_id”]/value)[1]‘, ‘varchar(50)’), 1, 36) AS uniqueidentifier) as activity_id, CAST(SUBSTRING(event_data.value(‘(event/action[@name=“attach_activity_id”]/value)[1]‘, ‘varchar(50)’), 38, 10) AS int) as event_sequence, CAST(SUBSTRING(event_data.value(‘(event/action[@name=“attach_activity_id_xfer”]/value)[1]‘, ‘varchar(50)’), 1, 36) AS uniqueidentifier) as activity_id_xfer FROM ( SELECT XEvent.query(‘.’) AS event_data FROM( – Cast the target_data to XML SELECT CAST(target_data AS XML) AS TargetData FROM sys.dm_xe_session_targets st JOIN sys.dm_xe_sessions s ON s.address = st.event_session_address WHERE name = ‘OldCheck’ AND target_name = ‘ring_buffer’ ) AS Data – Split out the Event Nodes CROSS APPLY TargetData.nodes (‘RingBufferTarget/event’) AS XEventData (XEvent) ) AS tab (event_data) ) xedata ORDER BY timestamp – ORDER BY activity_id, event_sequence [/code]
The output is ordered by timestamp, but you could just as easily order by any of the other columns in the result set. I wanted to see how things worked chronologically on the server.
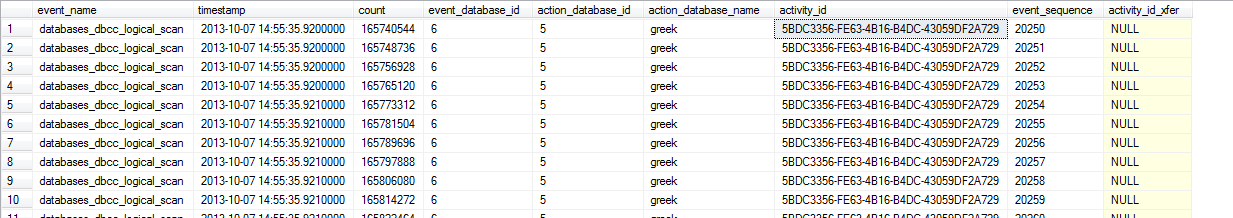
The first difference that I noticed is the amount of data returned. The older event session fired 1000 times whereas the new events accumulated only 44 rows. In the older event session, we’re given a raw count of scans against the database (seemingly ever). As illustrated by Robert, we see that these logical scans are occurring against a different database_id (action_database_id above) in the older session. Outside of that, we’re not getting much information.
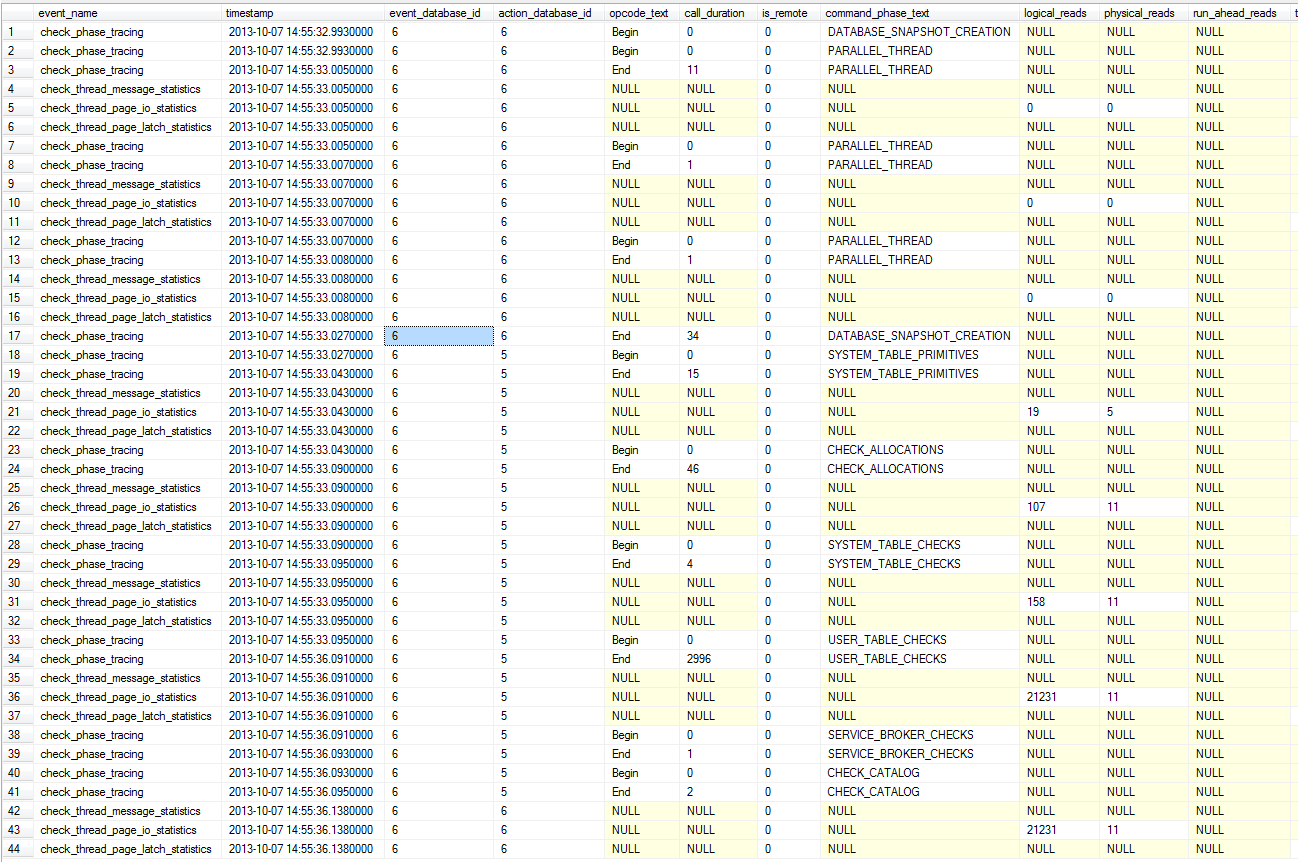
The new event session events are very interesting. We can trace the activity from start to finish. As we’d expect, we see events that parallel what MSDN describes as the order for DBCC CHECKDB. The check_phrase_tracing event has values for command_phase_text as well as what the type of activity is. Row 1 shows that the first step is to create a database snapshot (command_phase_text = DATABASE_SNAPSHOT_CREATION, opcode_text=Begin) and in row 17 we see the completion of the snapshot creation task (command_phase_text = DATABASE_SNAPSHOT_CREATION, opcode_text=End) and that the overall process took 34 ms (call_duration). We can also see that three threads were created to complete the task. I’m not sure if it’s coincidence, but each PARALLEL_THREAD command phase seems to have a finish-to-start dependency sequence, as well as different activity_ids which leads me to believe that this snapshot didn’t run with three parallel threads, but three serial threads.
After the snapshot has been created, we can see the DBCC CHECKDB process follows its set of operations and the length of time it took beginning with the system table primitives checks (15ms), then the allocations check (46ms), then system table checks (4ms), then user table checks (2966ms), then service broker checks (1ms), and finally the catalog checks (2ms). We can also see the number of logical reads, physical reads, latch waits, and the latch wait time.
Something that caught my eye was that the databases_dbcc_logical_scan “older event” activity started with an event_sequence of 20250 and ended at 21249 with an activity_id of 5BDC3356-FE63-4B16-B4DC-43059DF2A729. Looking at the new events, these correlate to the time between rows 33 and 34 in the results of the “new event” activity which have the same activity_id but have event_sequence of 176 and 21250, respectively. Additionally, [code language=“sql”] SELECT MAX(count) - MIN(count) FROM OldSession [/code] shows us that there were 8183808 logical scans and if we look at the new event data, check_thread_page_io_statistics recleals that there were 21242 total reads (21231 logical + 11 physical) throughout the process. This appears to be cumulative throughout the activity, so we can subtract the logical_reads from the USER_TABLE_CHECKS from the logical_reads for the SYSTEM_TABLE_CHECKS to get 21073 logical reads on the user tables (which, for reasons stated below, I believe correlates to the logical scans in the first event session data).
The time resolution doesn’t quite match up, with the dbcc_logical_scan (sequence 20250) reporting that it began at 2013-10-07 14:55:35.9200000 where the USER_TABLE_CHECK check phase noted that it began (sequence 176) at 2013-10-07 14:55:33.0950000. I suspect that there is some issue with the timestamp resolution that would need to be worked out with my query. Nonetheless, this gives us a pretty good idea of what happens when we run CHECKDB scans against our databases.
I’ve made a few assumptions here and don’t mind changing things up if others care to weigh in and let me know if these assumptions are incorrect.